

On Triolith, we have the Perf profiler tool installed on all computer nodes. It is pretty neat, because it allows you to look into your running jobs and see what they are doing, without recompiling or doing a special profiling run. This can be quite useful for locating bottlenecks in the code and to quickly check whether jobs appears to be running efficiently.
Here is a rundown on how do it. Suppose we are running a job on Triolith. First, we need to find out on which nodes the job is running on. This information is availble in the squeue output in the “NODELIST” column.
[pla@triolith1 ~]$ squeue -u pla
 JOBID PARTITION     NAME     USER  ST       TIME  NODES NODELIST(REASON)
 1712173  triolith _interac      pla   R       0:17      2 n[2-3]
If you are running a job on a node, you are allowed to use ssh to log in there and check what is going on. Do that!
[pla@triolith1 ~]$ ssh n2
....(login message)...
[pla@n2 ~]$
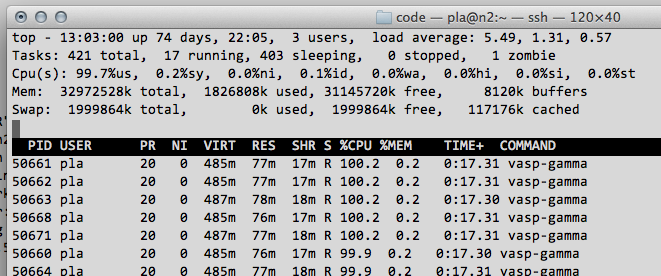
Now, running the top command on the node, will show us that they we are busy running VASP here, as expected.
The next step is to run perf top instead. It will show us a similar “top view”, but of the subroutines running inside all of the processes running on the node. Once you have started perf top, you will have to wait at least a few seconds to allow the monitor to collect some samples before you get something representative.
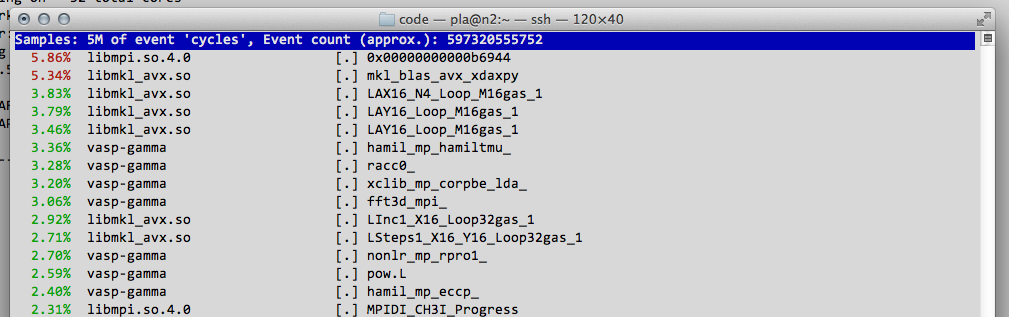
If your program is compiled to preserve subroutine names, you will see a continuously updating list of the “hot” subroutines in your program (like above) even including calls to external libraries such as MKL and MPI. The leftmost percentage number is the approximate amount of time that VASP, in this case, is spending in that particular subroutine. This specific profile looks ok, and is what I would expect for a properly sized VASP run. The program is spending most of the time inside libmkl_avx.so doing BLAS, LAPACK, and FFTWs operations, and we see some a moderate amount of time (about 10% in total) in libmpi.so doing and waiting for network communications.
For something more pathological, we can look at a Quantum Espresso phonon calculation, which I am deliberately running on too many cores.
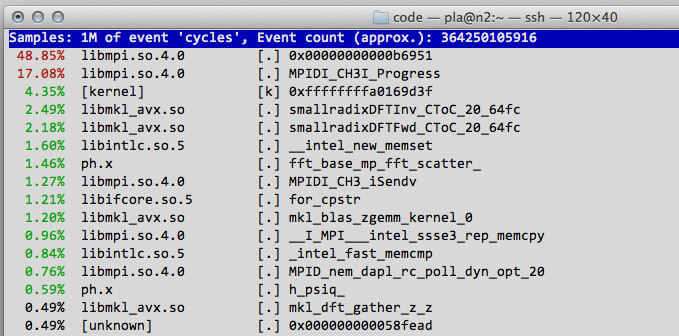
Here, something is wrong, because almost 70% of the time seems to be spent inside the MPI communications library. There is actually very little computation being done – these compute nodes are just passing data back and forth. This is usually an indication that the job is not parallelizing well, and that you should run it on less nodes, or at least use less cores per node. In fact, here I was running a phonon job of a simple metal on 32 cores on 2 compute nodes. The runtime was 1m29s, but it would have run just as fast (1m27s) on a single compute node with just 4 cores. The serial runtime, for comparison, was 4m20s. Now, 1 minute on 1 compute is not much time saved, but imagine the effect if this was a job running on 16 compute nodes for one week. That is a saving of 20,000 core hours.
There are much more things you can do with perf, for example, gathering statistics from processor performance counters using perf stat, but for starters, I would suggest using it as a routine check when preparing new jobs to run on the cluster. For big jobs using hundreds of thousands of cores, I would always recommend doing a real parallel scaling study, but for small jobs, it might not be worth it. That is when perf top comes in handy.