
Last update: 20:00 CEST, Jul 12
|
This page will refresh every 5 minutes Last update: 20:00 CEST, Jul 12 |
| Last 3 days | Last week | Last month | Last year |
|---|
| Tetralith | Sigma | Freja |
|---|
| Tetralith | ||
|---|---|---|
 
|
|
|

|
|
|
| Sigma | ||
|
|
|
|
|
|
|
|
| Freja | ||
|
|
|
|
|
|
|
|
| Nordugrid | ||
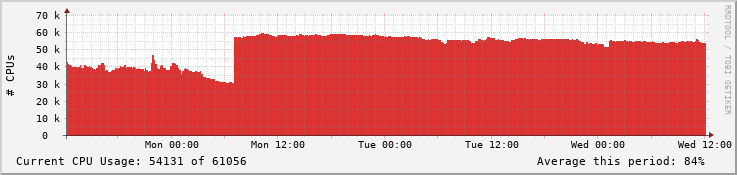
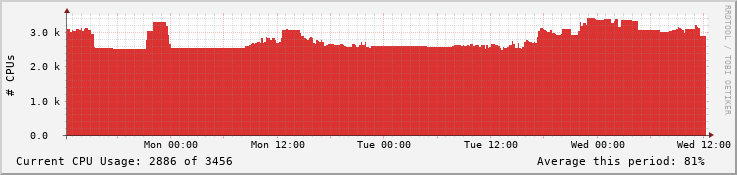
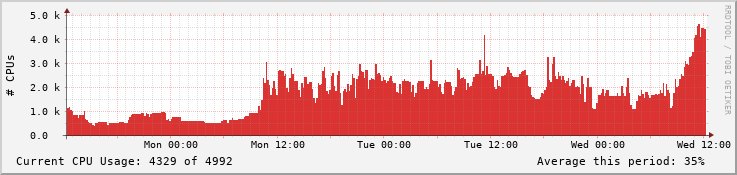
The red area shows how many processors are assigned to currently running jobs, which is a measure of how hard the cluster is working.
If enough free CPUs are available, you can submit a new job and expect it to be started at once.
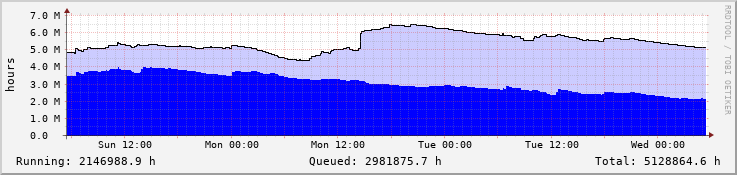
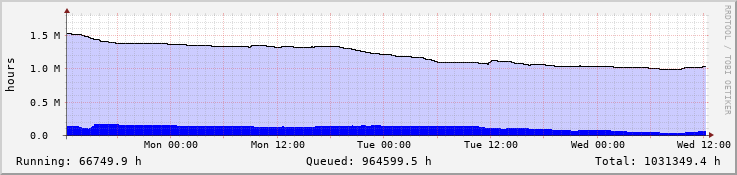
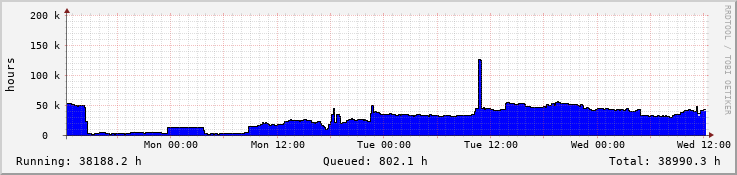
This graph, very roughly, indicates the future work load of the cluster. This gives a hint of how long a newly submitted job will have to wait in queue before being started. (Of course, this is subject to the resource needs of the job; if it needs few CPUs, the scheduler might be able to fit it in sooner.)
The dark blue area shows the total remaining wall clock time of the currently running jobs. This is a maximum figure; the jobs might well end earlier.
The light blue area shows the total estimated wall clock time of the jobs that currently have been submitted but not yet started.
Gray areas indicate that insufficient load data is available for that time period. Data might be missing because of downtime, either for the monitoring system or for the cluster itself, or it might not have been collected yet.