

One common question we get is “Why have my jobs been waiting in the queue for so long?” Upon investigation, it usually transpires that that the user is a member of a project that has run a lot of jobs recently. As a result, the job scheduler will suppress the priority of the newly queued jobs in order to let other projects have a chance of running. We have elaborated a bit on how Triolith’s queue system works on the NSC web page. I specifically recommend reading the section titled “How can I adapt the job scheduling to my workflow?”. The essence of it is:
There is no limit on how much a project can run in a month. But the more you run, the lower your priority will be, so the harder it will be to run the next job.
The relationship is actually non-linear, which is illustrated below:
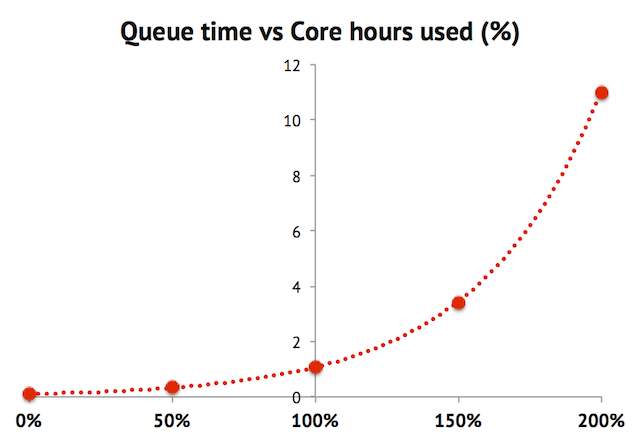
The queue time in the sketch is a normalized number, but you can imagine it as being days. The percentage representing the project usage is the actual core hours used during the last 30-day period divided by the given allocation, i.e. running 15,000 core hours when having been allocated 10,000 core hours/month by SNAC is 150% usage.
The key insight here is that running more than one’s allocation results in queue times approaching infinity. But note that the allocation, in terms of core hours/month is not a hard limit. It is possible to run more jobs, for example reaching 150% or 200% of your allocated hours for a month. It is even possible to do this consistently over several months if other projects relinquish their core hours. But borrowing from other projects comes at a cost: if your project is always above the allocated usage, the job priority is also always low as a direct result, implying long queue times, as shown in the sketch above.
This means that it is critical for a PI to manage the project to ensure that adequate resources are available when the participants need them. For example, if a PhD student needs to perform a large set of calculations next month in order to finalize their thesis, the PI must prevent the other project members from overusing the project during the current month and accumulating a low priority for everyone as a result. In certain cases, it might even be prudent to underuse the project in order to save up for a priority boost later.
Below, I will show two ways to monitor how the core hours are being used. That will hopefully be helpful in doing capacity planning and manage resource use over time.
The projinfo command
On Triolith (and all other SNIC systems), there is command called projinfo, which reveals the current status of the projects that you are a member of. Here is the output of a hypothetical SNIC project that would suffer from low priority and long queue times:
[x_secun@triolith1 ~]$ projinfo
Project             Used[h]   Current allocation [h/month]
   User
-----------------------------------------------------
snic2014-XX-YY         320807.82              250000
   x_prima               5877.88
   x_secun                  0.34
   x_terti              12229.15
   x_quart              22312.09
   x_quint              23944.71
   x_sextu              75189.68
   x_septi             181253.97
The two most important numbers are the ones in the top, which accounts for the actual usage (320k core hours) over the last 30 days and the target allocation (250k). Note that the first number is an average over a 30-day sliding window, not the number of hours used since the start of the month. Again, it is the relation between the core hours used vs the project’s allocation that controls the priority of jobs. In this case, the priority for all users in the project will be very low. The reason is that the project, as a whole, has overused its allocation. In order to balance the books, this project would need to run less than their allocation during the following month, so that the average value becomes closer to 250k core hours/month. It is the job of the queue system to enforce this through job priorities.
Inspecting project use over time
The projinfo command shows only the most recent 30-day period. For long-term statistics, you can log in to NSC Express. There, it is possible to inspect the historical use of resources for a project per month. The graphs are accessed by clicking on a project name in the table in the “Projects” section of your personal NSC Express page.
For example:
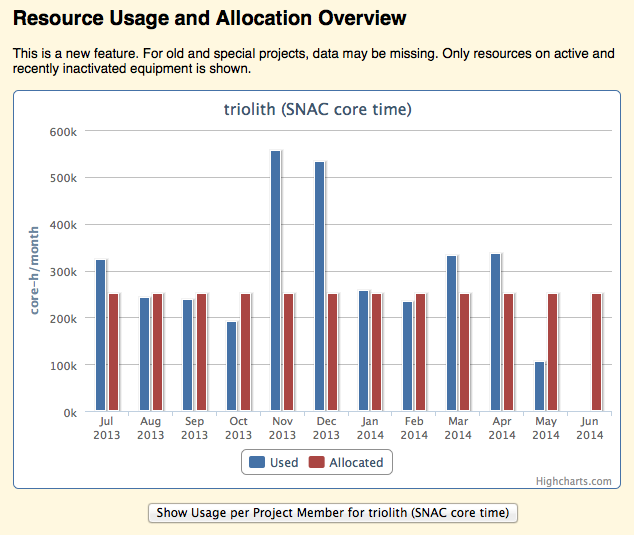
Here, one could imagine that around November-December, the queue time situation must have been particularly bad, whereas the other months were more in line with the allocated use and most likely more tolerable.