Chapter 5, Qualitative Computing
Françoise Chaitin-Chatelin, Elisabeth Traviesas-Cassan
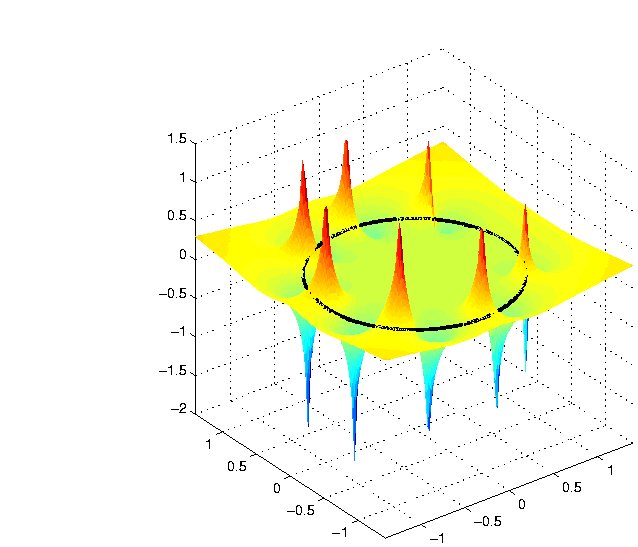
Figure 5.1 The map for the matrix One (n=8) in 3D. The alternating peaks and sinks are clearly visible.
Figure 5.1 The map for the matrix One (n=8) in 3D. The alternating peaks and sinks are clearly visible.


